> ## Documentation Index
> Fetch the complete documentation index at: https://blog.openkuber.com/llms.txt
> Use this file to discover all available pages before exploring further.
# Week-1 Delta — Setup, Launch, and Causal Steps
> This week we set up our Mintlify blog, moved our plugin to public release, and made progress on our causal AI pipeline.
## 🧱 Setup & Foundations
We kicked off the week by **setting up our blog** — the new home for all things OpenKuber: documentation, tech deep dives, and public delta logs.\
You can now follow along with our product iterations and research updates directly at [blog.openkuber.com](https://blog.openkuber.com).
*Our docs and blog now live side-by-side.*
## 🚀 Plugin Launch & Feedback Loop
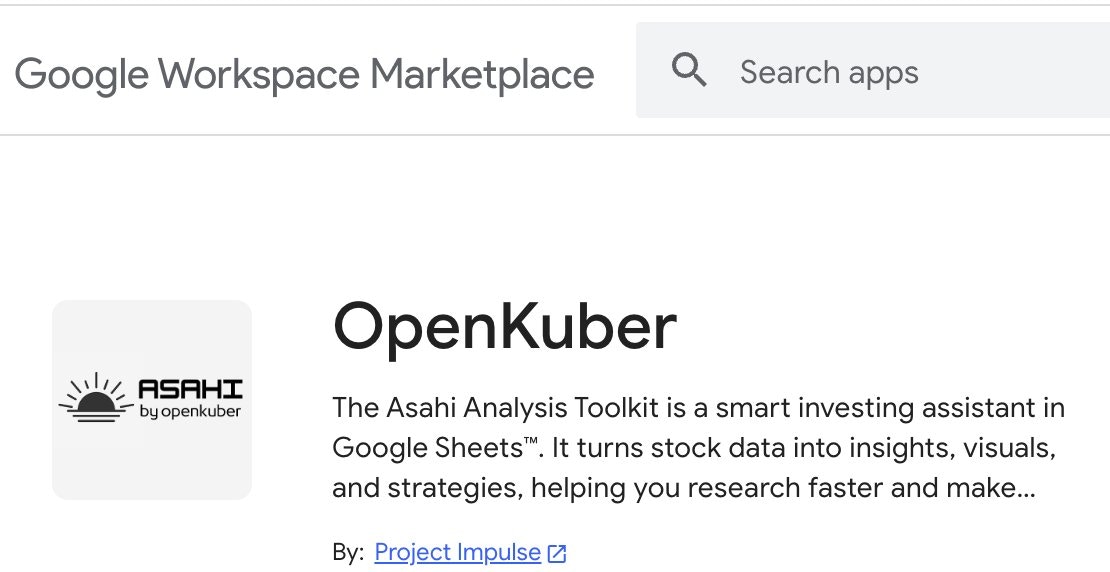
After applying for **marketplace release**, we gathered feedback from friends and family, refined our UX, and finally **moved the plugin from draft to public**.
We also reached out to **8 ICPs (Ideal Customer Profiles)** for more structured feedback — which led to **design changes that are now implemented**. We’re now **moving on to another set of ICPs** for the next round of **iterated feedback and design validation**.
> “User feedback drives clarity — and design iteration is where clarity meets craft.”
 ## 🤝 Design Partnerships & B2B Outreach
This week, we began **reaching out to RIAs (Registered Investment Advisors)** to explore design partnerships and B2B use cases.
These conversations are helping us shape how OpenKuber can serve financial professionals with precision and depth.
## 🎥 Product Storytelling
We spent time refining our **one-liner** and **elevator pitch**, turning both into short **video showcases** that visually represent our message and intent.
This was also the week we **published our manifesto** — the “why” behind OpenKuber.\
It outlines our ideological roots and long-term vision for democratizing structured financial insight.
A manifesto video is also in the works — designed to make our story more experiential.
## 🧠 Causal AI Development
We formalized our **Causal AI roadmap**, broken into three key steps:
1. **Data Preparation** — already implemented during plugin setup, now fine-tuned for causal discovery.
2. **Causal Discovery** — currently being polished and configured for tighter integration.
## 🤝 Design Partnerships & B2B Outreach
This week, we began **reaching out to RIAs (Registered Investment Advisors)** to explore design partnerships and B2B use cases.
These conversations are helping us shape how OpenKuber can serve financial professionals with precision and depth.
## 🎥 Product Storytelling
We spent time refining our **one-liner** and **elevator pitch**, turning both into short **video showcases** that visually represent our message and intent.
This was also the week we **published our manifesto** — the “why” behind OpenKuber.\
It outlines our ideological roots and long-term vision for democratizing structured financial insight.
A manifesto video is also in the works — designed to make our story more experiential.
## 🧠 Causal AI Development
We formalized our **Causal AI roadmap**, broken into three key steps:
1. **Data Preparation** — already implemented during plugin setup, now fine-tuned for causal discovery.
2. **Causal Discovery** — currently being polished and configured for tighter integration.
 A trading strategy backtest can be viewed as a **causal machine** where every step is a precise causal link, moving information forward through time. It begins with**data formation** by looking back at the historical price data (e.g., \$t-k\$ to \$t\$) to calculate technical indicators (like RSI or MACD) at the current time, \$t\$. These technical indicators form the inputs for **causal graph discovery**.
\
These variables at time \$t\$ are used to generate a **trading signal** and, subsequently, an **order size**. The most crucial link is the **temporal causality**: the executed trade at \$t\$ is the direct cause that forces a definitive change in the portfolio's state (position, cash, value) at the immediate next timestamp, \$t+1\$. Finally, the portfolio's value at \$t+1\$ is the direct cause of the resulting performance and risk metrics (like **drawdown**) establishing a Directed Acyclic Graph from historical market inputs to future performance outcomes.
3. **Causal Inference** — in planning phase, being mapped out conceptually before implementation.
Each stage moves us closer to an interpretable intelligence layer that goes **beyond correlation — toward cause and effect.**
## 📈 Marketing & Early Reach
We ran a few **Twitter and YouTube experiments** to test early engagement and organic reach — and the numbers look promising.
The focus remains on authentic storytelling and community-driven feedback.
*Thanks for following along. Every week, we’ll share transparent updates as we build in public — step by step.*
### 🔗 Follow Our Journey
* 🐦 Twitter: [@OpenKuber\_Sxnk](https://x.com/OpenKuber_Sxnk)
* 📺 YouTube: [OpenKuber Channel](https://www.youtube.com/@OpenKuber)
A trading strategy backtest can be viewed as a **causal machine** where every step is a precise causal link, moving information forward through time. It begins with**data formation** by looking back at the historical price data (e.g., \$t-k\$ to \$t\$) to calculate technical indicators (like RSI or MACD) at the current time, \$t\$. These technical indicators form the inputs for **causal graph discovery**.
\
These variables at time \$t\$ are used to generate a **trading signal** and, subsequently, an **order size**. The most crucial link is the **temporal causality**: the executed trade at \$t\$ is the direct cause that forces a definitive change in the portfolio's state (position, cash, value) at the immediate next timestamp, \$t+1\$. Finally, the portfolio's value at \$t+1\$ is the direct cause of the resulting performance and risk metrics (like **drawdown**) establishing a Directed Acyclic Graph from historical market inputs to future performance outcomes.
3. **Causal Inference** — in planning phase, being mapped out conceptually before implementation.
Each stage moves us closer to an interpretable intelligence layer that goes **beyond correlation — toward cause and effect.**
## 📈 Marketing & Early Reach
We ran a few **Twitter and YouTube experiments** to test early engagement and organic reach — and the numbers look promising.
The focus remains on authentic storytelling and community-driven feedback.
*Thanks for following along. Every week, we’ll share transparent updates as we build in public — step by step.*
### 🔗 Follow Our Journey
* 🐦 Twitter: [@OpenKuber\_Sxnk](https://x.com/OpenKuber_Sxnk)
* 📺 YouTube: [OpenKuber Channel](https://www.youtube.com/@OpenKuber)